Software Environment
Python Anaconda Installation
We will be using a distribution of python known as Anaconda Python, which comes shipped with the majority of the tools that we need for the course. Click here to download Anaconda. Please choose the 64-bit version of Python 3.8 for your operating system (Windows/Mac/Linux), download it, and follow the default options during installation, includng registering this as the default Python for your system.
Once you install Anaconda, you should be able to launch Spyder and Jupyter, which are the two environments we will be using to write and run code. Under Windows, you can launch these programs by searching for them in the search bar. Under Mac/Linux, you can run them by typing spyder and jupyter, respectively, in the command prompt.
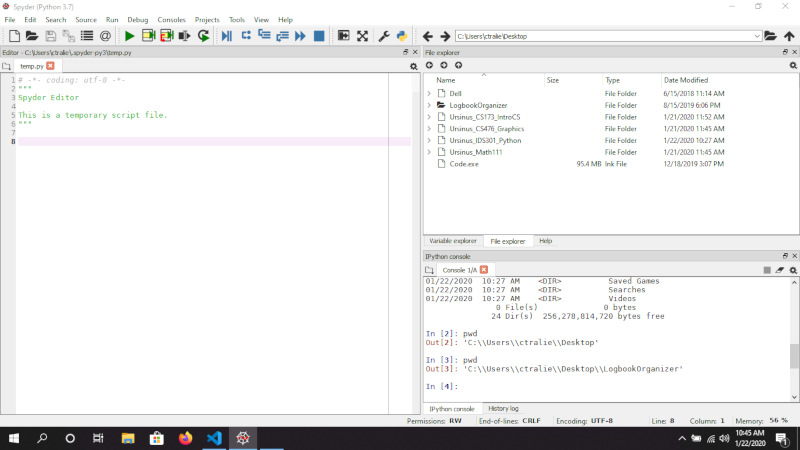
Below is a picture of what Spyder looks like
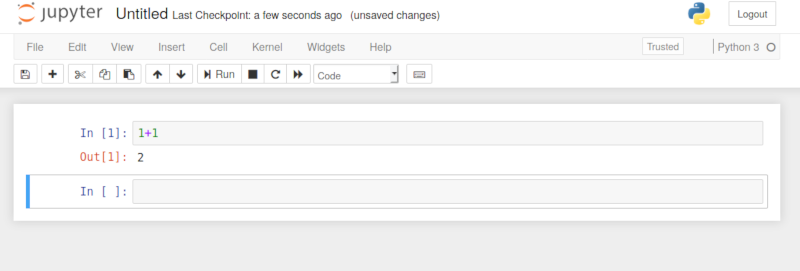
Below is a picture of what jupyter looks like
What I often recommend as a workflow is to first mock ideas up in Jupyter since it's so interactive. Then, once things seem to work and you're ready to organize things better, you can copy code over to modular .py files. You can then import these files into other jupyter notebooks and use them later.
These days, to keep things clean, I almost always use Jupyter as a front end for loading data and plotting results, while the code that does the heavy lifting and algorithms is in separate files.
Visual Studio Code Installation with WebServer
Towards the end of the course, we will be using tensorflow.js to train deep learning models in Javascript. This is because deep learning software is an incredible pain to get setup in Python, and you need a CUDA compatible graphics card to run it. By contrast, even though js is a bit slower, it should work on anyone's computer.
To make this as easy as possible, we use an Integrated Development Environment (IDE) known as Microsoft Visual Studio Code (VSCode), which will make it easy to organize your projects and to run the code you write. Please visit this link to download VSCode for your appropriate operating system. Most Windows and Linux users will want the 64-bit download. Please post on Discord if you are having any issues installing VSCode.
Live Server Plugin
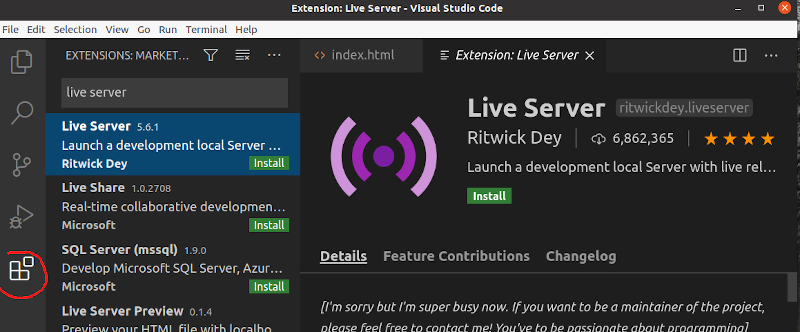
VSCode has a ton of awesome, open source plugins. One that's particularly useful for our course is a local web server that can launch your pages in the browser and automatically refresh them as you save your file. Once you have downloaded VSCode, you will need to click on the Extensions button (circled in red in the image below) and search for Live Server, and then click install
Then, open a top level folder containing the code that you want to run, right click on an HTML file you want to run, and click Open with Live Server
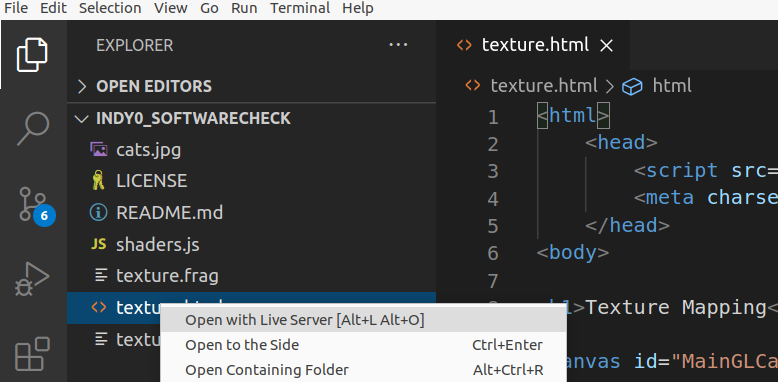
This will then launch your code in a browser window, and as you type and save any code that the HTML page depends on, it will automatically refresh in the browser(!!).
If you want to change the default browser that opens with the live server, then you have to change the settings.json to have the CustomBrowser field. For example, my settings.json file has the following code to get it to launch Chrome by default
The GIF below shows how to access the settings.json file
NOTE: The assignments have been tested in Firefox and Chrome, so it's best if you stick to one of those browsers.
Quick Features Overview
Below are a few features I want to highlight that will come in handy as your working.
Unused variable highlighting
If you don't use a variable, it will show up in darker text. This is very useful when debugging. It means that either you didn't actually need the variable, you forgot to use it (hence you didn't complete your code), or you spelled it wrong somewhere. This saved many a student last year!
Replace within Selection
If you want to change the name of a variable in one section of your code, you can do a CTRL+F, which will bring up the find/replace menu, then follow these steps:
Debugging Javascript
Firefox and Chrome have robust tools built in that you can use to debug your code. On most computers, you can hit F12 to bring up the debugging console. There, you will see any output from console.log(), and you will be able to set breakpoints in an interactive debugger.